Using probabilistic methods to improve Bijupira/Salema well predictions
S. Zoller
Enterprise Oil do Brasil
J. Graulier
A. Paterson
The Peak Group
Use of a probabilistic approach in plan-ning the development drilling pro-gram for the Bijupira and Salema fields offshore Brazil allowed Enter-prise Oil to realize significant time and cost savings. Models generated for an initial study facilitated key decisions regar-ding choice of technology and methods to improve performance.
The Bijupira and Salema fields in Brazil's Campos basin were discovered in 1989. They are 5 km apart, 120 km east of the Rio de Janeiro state coastline, in water depths of 550-850 m. Enterprise Oil acquired an 80% share and operatorship of both fields in 2000.
Fifteen new wells were required to access nine horizontal production and six injection well targets. Enterprise's well engineering team demonstrated that substantial savings could be made through minimizing the number of top-hole locations needed to access all 15 targets. The team drew up a plan to drill and complete all 15 wells from two drilling clusters, one on each field.
This plan carried several inherent risks. For example, long-reach and 3D wells would be required with 12 1/4-in. hole sections through a notoriously problematic conglomerate formation. The 800-m, 8 1/2-in. hole sections through the reservoir would require sand control measures, and the risk of differential sticking would be high due to depletion from pilot production.
Scheduling was also considered critical due to concurrent well construction and manifold installation operations. The team had to generate estimates of well construction duration, with realistic start and end dates for the operation's various phases.
Recognizing that the traditional deterministic approach to estimating well times and costs was inadequate for this project, Enterprise opted for a probabilistic approach using Peak's P1 software. This application was developed to allow well engineers to build up complex models with multiple levels of unplanned events for single-well projects (drilling, well intervention, or workover). For the Bijupira and Salema project, a multi-well version was developed.
The first step in modeling the campaign was to build a generic P1 well model that could be used as a template for all 15 wells. This entailed collecting offset data and extrapolating values for all key parameters, such as rate of penetration (ROP), tripping speeds, and BOP running times. To build this model, the team had to consider not just the risks involved, but also the potential upside, i.e., could a hole section be eliminated? The likelihood of certain events also needed to be quantified, based on offset data and expert opinion, while factoring in necessary remedial action.
A meeting of all interested parties, including contractors responsible for the rig, directional drilling, gravel packing, and completions, convened. A first P1 well model was built up during this meeting to account for potential upside and downside, and this was refined during further sessions.
Although the first well was to be drilled in one continuous operation to prove up the well design, the remaining wells were to be drilled using a batch approach. For example, a batch of four wells would be drilled by drilling four top hole sections, then four 12 1/4-in. hole sections, then four 8 1/2-in. hole sections and so on. In all, seven batch phase types were defined from top hole through to running of the subsea trees.
P1 allows models to be built in vertical depth, using the well trajectory to calculate measured depth and thereby, the drilled intervals. In the case of Bijupira and Salema, most of the casing depths were planned for the same vertical depth for each well. Having generated the generic well model in vertical depth and split it into the seven batch phases, engineers could model batch phases for the remaining wells simply by changing the well trajectory.
The team's focus moved from there to assembling all the batch phase models to allow modeling the entire drilling campaign. Each P1 model produces probabilistic distributions of duration and cost for the whole well (or in this case, batch phase), and also for each operations phase. For example, the top hole batch phase models constituted three operations phases: jet 30-in. conductor, drill 17 1/2-in. hole, and run 13 5/8-in. casing. Based on output from the batch phase models, 360 operations phases were assigned to complete the 15 wells.
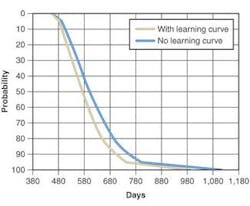
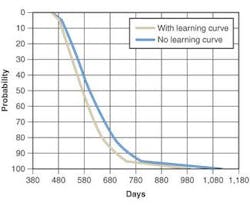
At this stage, application of a learning curve was required. It became clear that applying the traditional learning curve concept, developed for deterministic time estimates, to probabilistic data would not be straightforward. In a probabilistic model, each well is described not by a single duration, but by a probable distribution of durations. In a conventional Monte-Carlo process, the simulator produces a random value for the duration of the well. Multiplying this value by the learning co-efficient can produce a value below the P0 value of the original distribution.
In the end, a new approach was adopted for Bijupira and Salema. The duration (Dn) of the nth well in any iteration of the Monte Carlo simulation would be described by the following equation:
Dn = D0 + (1 – an)*Dx
Where D0 is the P0 duration (or technical limit) for this well, an is the co-efficient used to multiply the duration of the first well to determine the duration of the nth well, and Dx is the value selected randomly by the simulator in the distribution for this well.
Using this equation, no duration below the P0 duration can be generated. In effect, the distribution has shifted to the left, i.e., toward the low outcome, without changing the P0 value.
The team accepted that there would be differing learning levels for different types of operation. They decided, therefore, to use three learning curves:
- Curve H for openhole operations (drilling)
- Curve M for mechanical operations (running casing)
- Curve R for rig operations (BOP handling, rig moves).
For each of the campaign's operations phases, the corresponding P1 outputs were extracted. These appear in the form of a cumulative probability curve, represented by the sequence P0, P5, P10, and up to P100. To run a Monte-Carlo simulation, a statistical distribution must be matched to these data. This was done using Palisade's BestFit software. A beta distribution proved to be best equipped to match the output data. Obtained distributions were then factored into a Monte-Carlo simulation to generate the overall well campaign duration and cost.
The team also believed correlating like activities would enhance the Monte- Carlo process. In a simulation pro-cess, the processor picks durations for activities at random; however, each iteration of the simulation is intended to represent one possible outcome of the project. In real life, if an operation is performed efficiently, the expectation would be that the next operation of the same type would be similarly efficient. This process, correlation of like act-ivities, leads to expansion of the distribution, which is a better repre- sentation of reality.
null
The probabilistic campaign model gave the Bijupira and Salema team the confidence to proceed to full project sanction. The project was successfully completed within budget. Additionally, the P1 models generated for the initial study were used prior to and during operations to facilitate several key decisions regarding choice of technology and methods to improve performance. Such decisions included the following:
- Use of rotary steerable systems enabled drilling of the 12 1/4-in. hole section in one bit run and at overall ROPs more than twice the offset
- Probabilistic analysis of differing sand control technologies at the bid evaluation stage allowed selection of a fit-for-purpose high-rate water pack approach where more expensive systems had been thought necessary
- Elimination of the 8 1/2-in. hole section on long-reach injector wells resulted in a cost savings of around $500,000 per well
- Oil-based mud was intuitively thought to be the best option for drilling 8 1/2-in. hole; however, probabilistic analysis of the risks of drilling the 8 1/2-in. hole section with water based mud instead of oil based mud resulted in the selection of water based mud and savings of around $250,000 per well.
In summary, every decision facilitated using P1 on the Bijupira and Salema project was ratified by operational success, bearing testimony to the thorough approach that probabilistic analysis offers.
Reference
Brett, J.F. and Millheim, K.K. : "The Drilling Performance Curve, a Yardstick for Judging Drilling Performancs." SPE Annual Technical Conference and Exhibition, New Orleans, October 1986.