Low-cost approach to depth correction of printed seismic sections

Depth correction of seismic reflection profiles is essential for effectively locating features in subsurface data in petroleum exploration and research. With depth-corrected seismic, the geometric relationships in the profile are accurate, so that measured angles and lengths can represent actual dips and distances.
This process is useful for measuring fault displacements, calculating sedimentation rates, and finding oil traps. Previously, it was difficult to get depth data from paper printouts of seismic profiles, but now there is software that can depth-convert images of scanned profiles.
Without depth correction, a seismic profile displays the time for the seismic signal to reflect off some feature. Because of the differing seismic velocities of geologic materials, the apparent vertical position of features is distorted in a time section. This is particularly an issue for offshore data, where the low seismic velocity of the water column exaggerates the effect of topography. By applying a model of seismic velocities, the time profile can be converted to a depth profile.
Depth correction is standard with newly acquired profiles using digital data, but for seismic reflection profiles existing only as paper printouts, conventional techniques cannot be used. A need has existed up until now to re-interpret old seismic data without returning to the field for reacquiring data digitally.
Geometric solutions
A technique was developed to depth-correct scanned images of seismic reflection printouts. Petroleum exploration geophysicists and academic researchers have used this technique to solve geometric solutions when digital data is not available or inconvenient. This makes storehouses of unused printout data available for better geophysical analysis, opening up possibilities for mining new information from vast but under-used data.
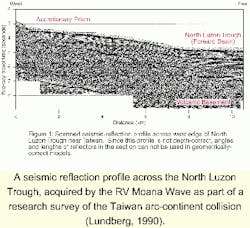
The seismic profile (see accompanying figure) along the west edge of the North Luzon Trough between Taiwan and the Philippines is a six-channel migrated profile, but is not depth corrected. It shows a blind eastward-vergent thrust near the volcanic basement that does not cut across basin strata, but whose presence is made known by the folding.
The varying thickness of sedimentary reflectors on the edge of the basin shows that fault growth and sedimentation happened simultaneously, giving clues to the history of deformation on the fault.
Balanced cross-sections
To actually make a balanced cross-section to determine the geometry and timing of deformation the time profile must be converted to a depth profile. The digital seismic data and requisite software were not available for this project, only rolls of printouts. The printouts were scanned as high-resolution image files. For this project, reduced photostats of the profiles were processed with a desktop scanner, but subsequent projects have used roll scanners that can digitize a 36 in.-wide profile directly. The Seismic Plugin software that works within Adobe Photoshop was then developed to perform depth correction.
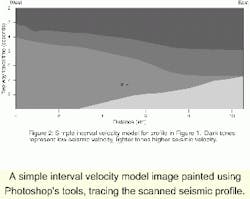
A simple interval velocity model image can be painted using Photoshop's tools, tracing the scanned seismic profile. The low seismic velocity of water is represented by dark gray pixels, and increasing velocities are represented by lighter shades, up to the light gray of the volcanic basement. Each pixel in the scanned seismic profile is given a velocity pixel, so the velocity model can be as complicated as necessary.
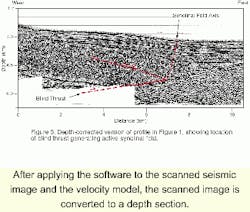
After applying the software to the scanned seismic image and the velocity model, the scanned image is converted to a depth section. Pixels in each column of the image were shifted vertically according to the pixel values in the velocity model. The exaggerating effects of the water column are eliminated, so that angles and distances measured in the depth section can be used to model the fault geometry as a wedge thrust that reverses vergence (direction of fault thrusting) at the fold axis.
Older archives
When exploration and research are done in developing countries, there may be limited access to new digital data. Hard-copy printouts of seismic profiles are more readily available. Once again, the technique of scanning printouts and depth correcting the images can virtually open up an archive of knowledge that would otherwise be left untapped.
For example, scanned, depth-corrected seismic reflection profiles proved useful in industry work recently published by Shaw et al, 1999 concerning the Ucayali basin of Peru and ongoing academic work by Suppe et al, 1999 in the Tianshan of western China.
Recent projects
Shaw et al created a balanced kinematic model of imbricate faulting in the basin in the Peruvian Andes, using satellite imagery and seismic reflection profiles. Depth-corrected subsurface data were essential to determine the sequence and geometry of thrusting. They had access to time-section printouts of seismic reflection profiles, which were scanned and depth converted using the software.
The resulting dip angles of reflectors correlated well with slopes of flatiron features at the surface. They then used orientations of fold axes on the surface and in the depth-corrected profiles to constrain the sequence of deformation along the imbricate thrust faults. The resulting model identifies fold and fault closures that may contain large hydrocarbon traps.
In the area of academic research, scanning printouts and depth correcting images also proves vital for allowing research groups to utilize previously acquired data that they could otherwise not afford to acquire. Currently at Princeton University, Suppe and Hubert-Ferrari (1999) are researching the deformation history in the thrust belt of the southern Tianshan in China, using surface measurements, magnetic stratigraphy, seismic, and well data.
The seismic data are used to measure growth strata to determine when folds began to form and how much shortening they have undergone. Such geometric analysis requires seismic profiles to be depth corrected, and again in this case, only paper profiles were available to be scanned and depth corrected with the software.
Conclusions
Applying depth correction to seismic profiles should also prove effective in domains such as salt dome provinces. The high velocity contrast between the salt and surrounding rock and the salt dome's irregular shape requires depth correction to accurately locate possible hydrocarbon traps around the dome.
Similarly, depth correction is important in faulted domains like listric systems. The fault can place low-velocity blocks against high-velocity blocks, and depth correction is needed to fix the geometry.
Depth correction lets the explorationists make better use of data they may already have. The geometrically correct images yield more accurate locations and orientation of structures that act as hydrocarbon traps. Scanning printout data and applying depth correction to the image gives legacy data new value, by allowing precise geometric analysis to be done.
Furthermore, an image processing technique such as this may be easier for the explorationist to try quick checks of a velocity model against a subset of digital data before apply ing the model with conventional algorithms.
Acknowledgments
The author wishes to thank John Suppe, Frank Bilotti, and Neil Lundberg.
A complete list of references is available from the author, E-mail: [email protected].